
At UseLess Company, we calculate the carbon footprints of our customers’ organizations and products and support them in their climate efforts. We are a company that practices what we preach, which is why we have calculated our own carbon footprint annually since 2020. Through annual calculations, we can track the development of our emissions and identify areas where emissions can be reduced.
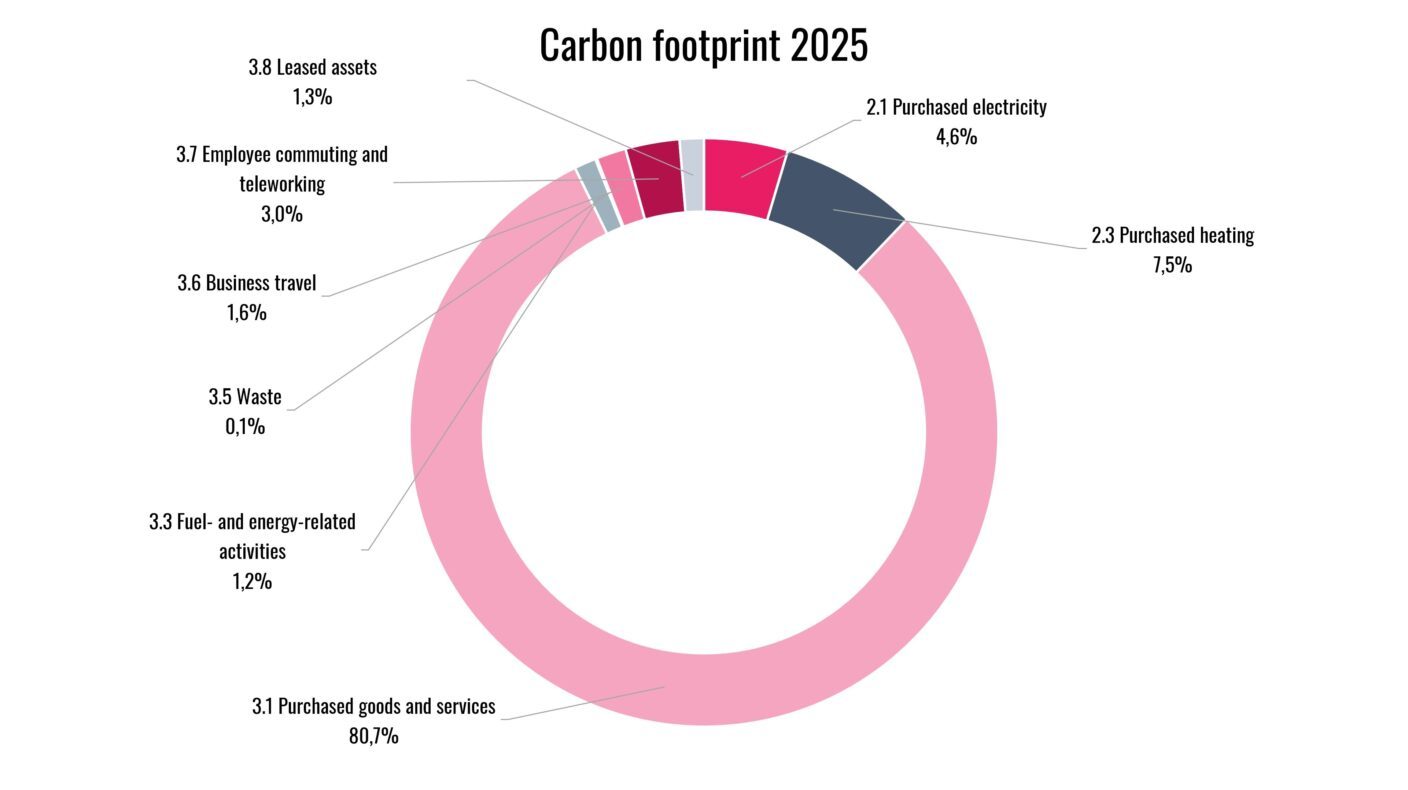
In 2025, our company’s greenhouse gas emissions consisted of purchased goods and services as well as assets leased for our own use, energy consumption, business travel and commuting, remote work, and waste management (Figure 1). Electricity and heat consumption at the office fall under scope 2 in carbon footprint accounting, and they are our only source of emissions from our own operations. Our carbon footprint in 2025 was 12 137 kgCO₂e. This corresponds to the average annual emissions of approximately 1,3 Finns.¹
The largest share of emissions, 81 % of total emissions, came from purchased goods and services (category 3.1). Emissions from purchased electricity and heat (categories 2.1 and 2.3) together accounted for 12 % of the total carbon footprint. Emissions from the other categories were clearly smaller in comparison.
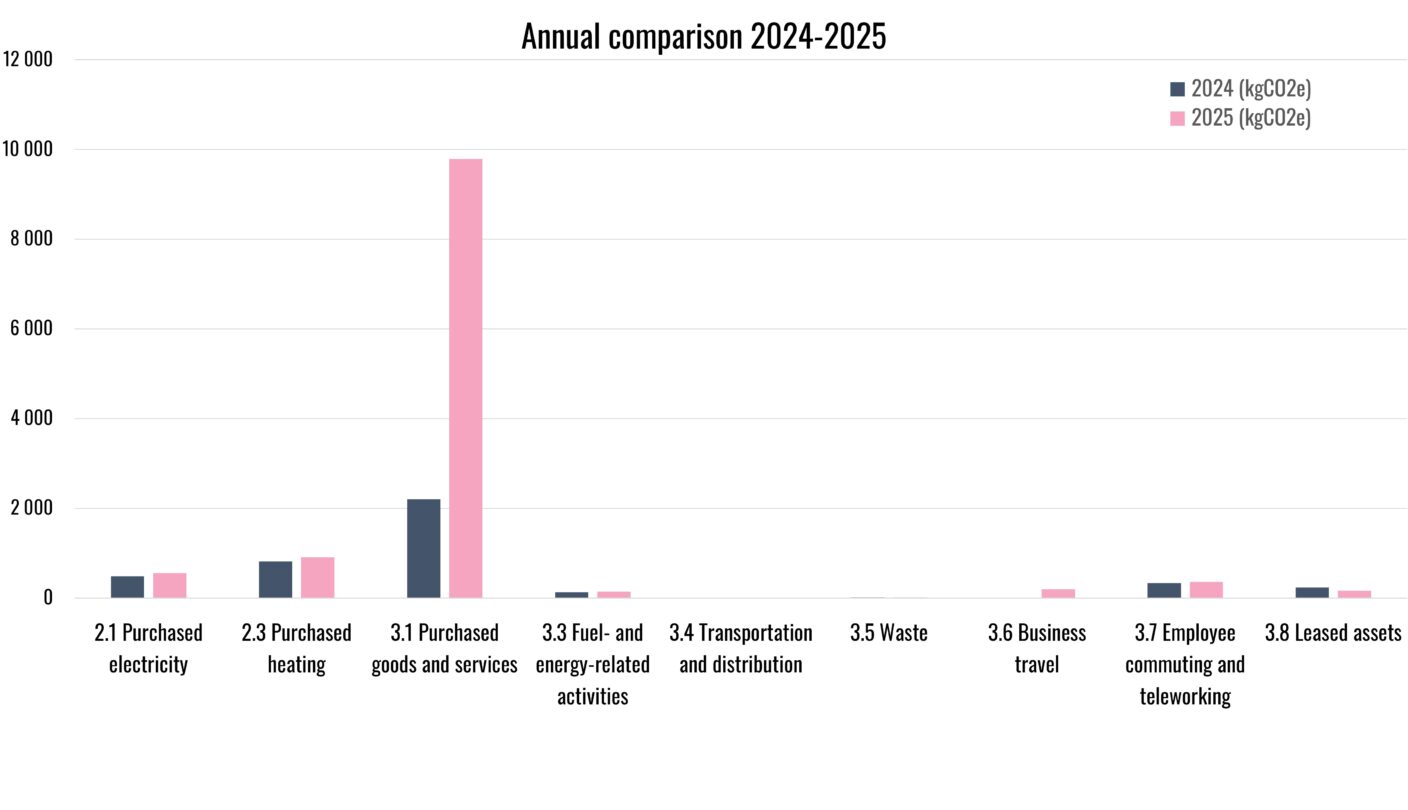
Our carbon intensity per EUR revenue in 2025 was 27 gCO₂e/€. This can be considered as the emission factor of the services we provide. In 2024, this same carbon intensity was 12 gCO₂e/€, i.e. the carbon intensity increased by 121 %. Our carbon intensity, however, grew significantly less than our absolute carbon footprint (+188 %), meaning that we have been able to reduce our emission intensity despite our company’s growth.
By comparing results annually, we can track the long-term development of emissions and assess the effectiveness of our climate actions. UseLess Company’s comparison between 2024 and 2025 is shown in Figure 2. The most significant change compared to the previous year is the increase in purchased goods and services. This is partly due to the growth of our staff during the reporting year, which led to new purchases tied to personnel size. In addition, we invested significant amounts in marketing development and renewed our website, which also affected emissions in category 3.1. The overall quality of initial data also improved, increasing the accuracy of our calculations.
Naturally, there are year-to-year changes in the types of emission sources present in company operations. During the reporting year, for example, business travel that did not take place at all the previous year occurred. Incoming transport, on the other hand, did not occur unlike in 2024. Overall, all changes in the calculated carbon footprint are consistent with the changes in the company’s operations during the reporting year.
How can we reduce UseLess Company’s climate impact?
At UseLess Company, we already have internal practices in place to reduce the climate impact of our operations, and we intend to continue following them:
- We favor plant-based food: At our events, we only serve fish or vegetarian meals.
- We travel using low-emission options: We prioritize public transport travel, avoid car use and especially flying.
- We buy furniture second-hand: Currently, all the furniture in our office has been purchased second-hand.
Based on the 2025 carbon footprint calculation, we have identified new opportunities for emission reductions. As shown in Figure 1, purchased products and services account for more than half of our emissions. We aim to purchase new office equipment, such as monitors, second hand whenever possible. Before making any purchase decisions, we will also consider whether the purchase is truly necessary. Furthermore, we want to influence the emissions generated by the services we purchase and as such, have included the carbon intensity of services as part of our purchasing policy. We also consider other environmental aspects such as different environmental certificates.
Next year, we will once again calculate UseLess Company’s carbon footprint. Then we will be able to see how well we have succeeded in implementing our emission reduction measures!
Sources
- Sitra (2023). Carbon footprint of the average Finn. https://www.sitra.fi/en/articles/carbon-footprint-average-finn/